Kaiko's Q1 market report is now live!


How to Spot Artificial Volume
Written by Conor Ryder, CFA
09/02/2023

Welcome to Deep Dive!
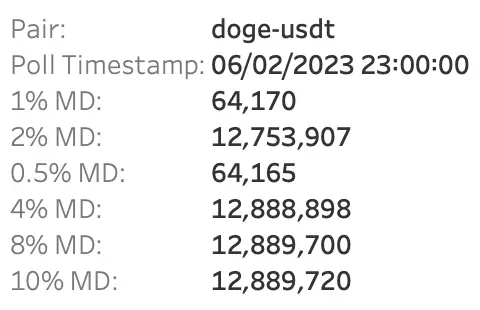
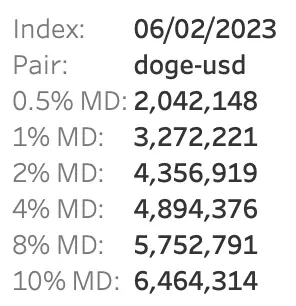
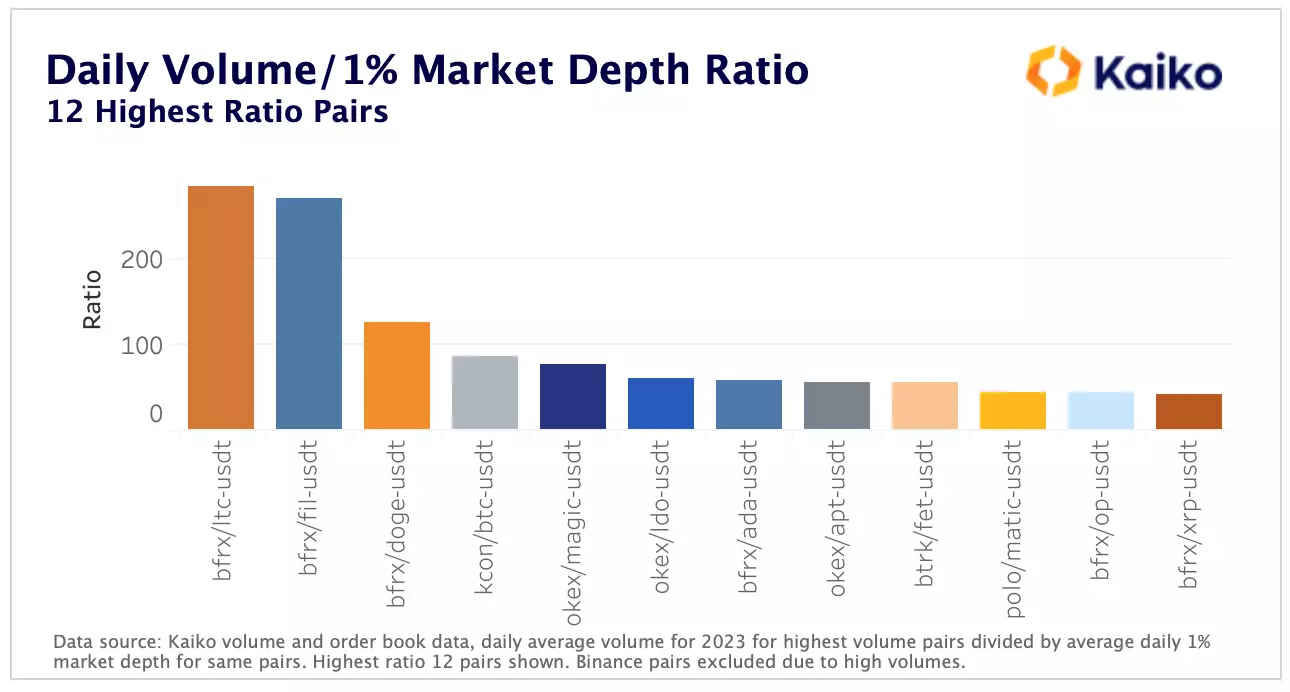
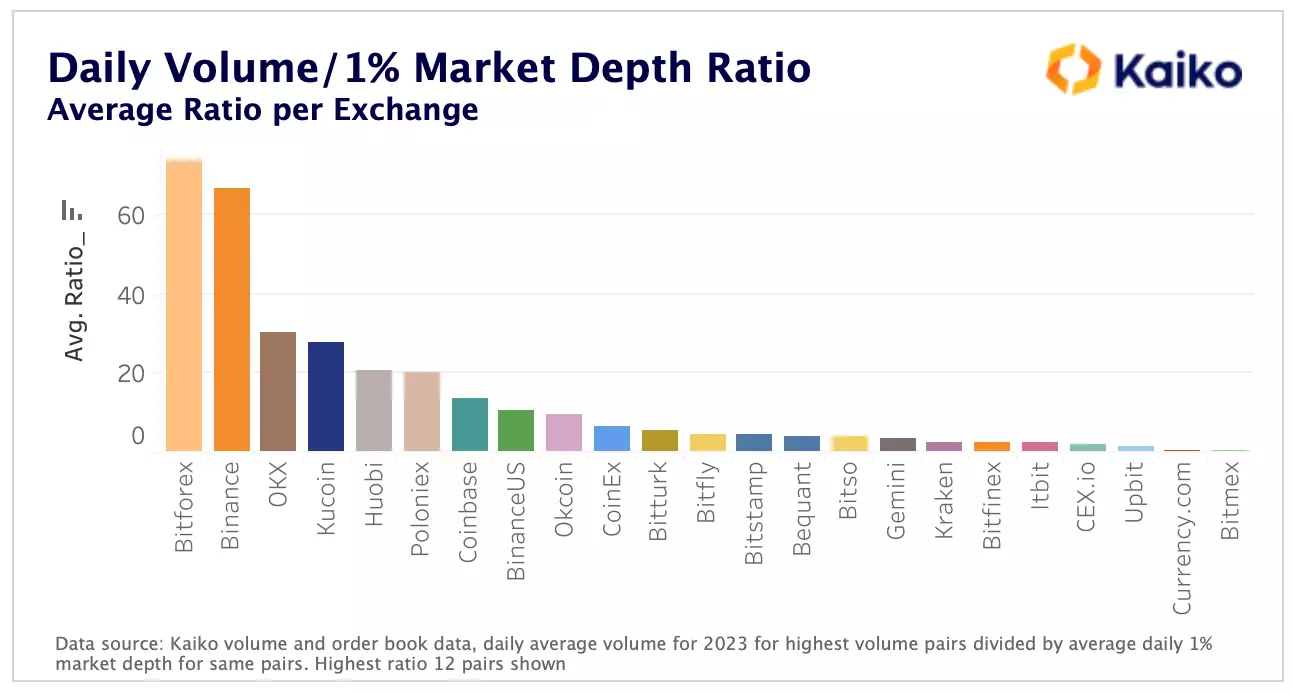
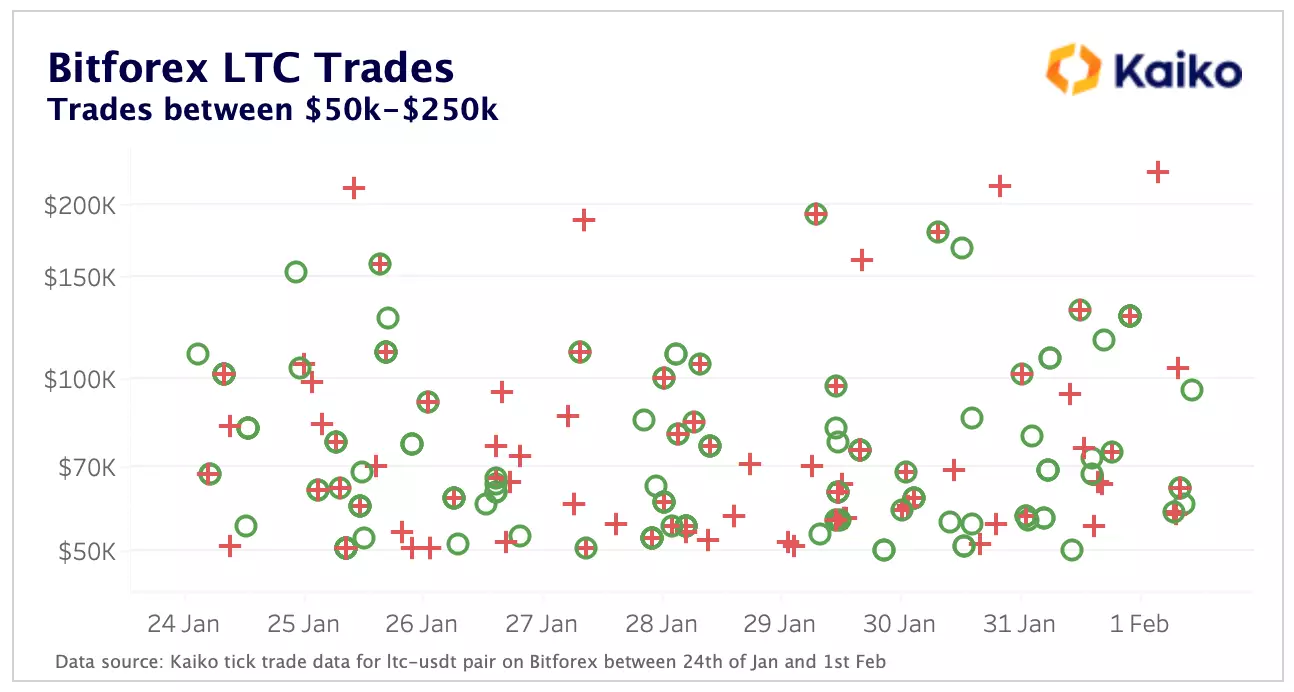
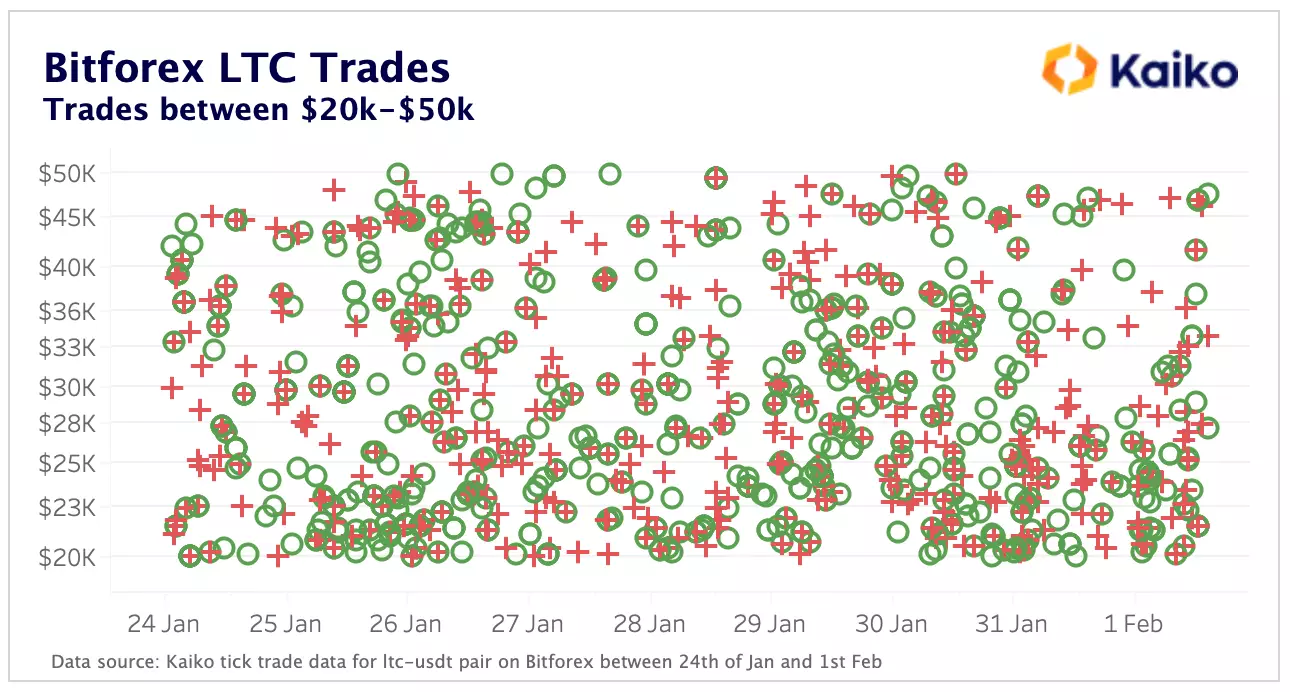
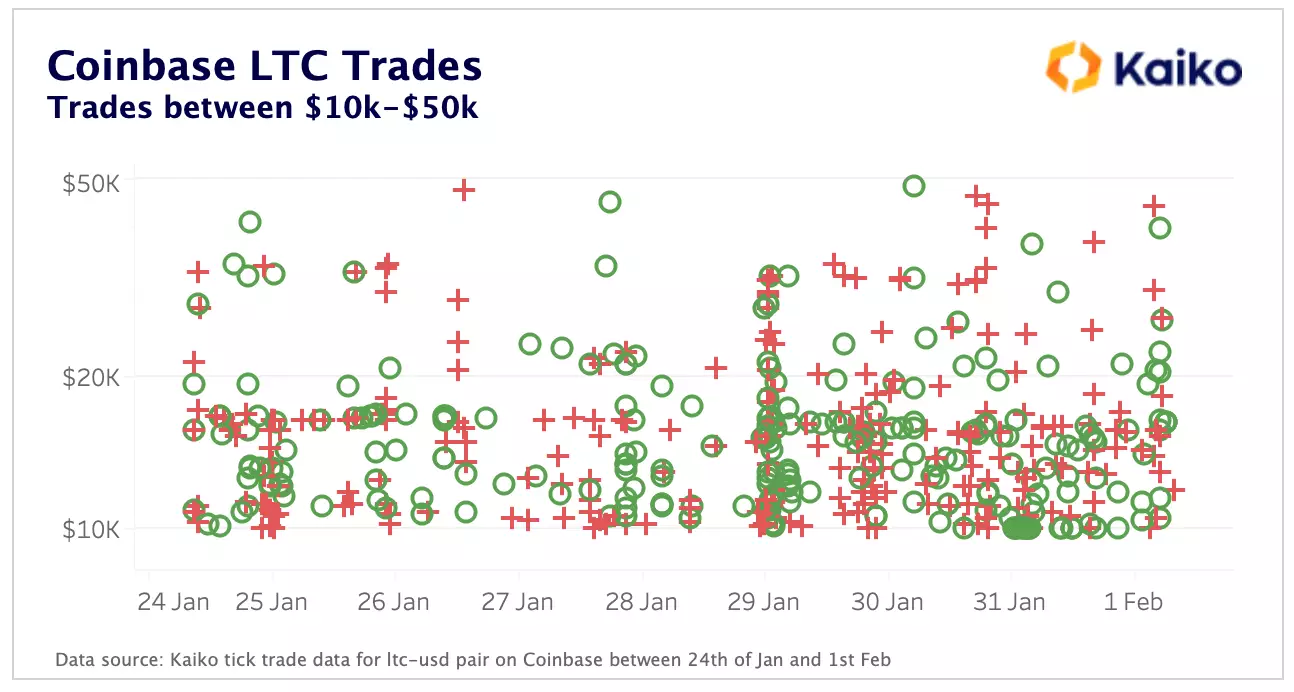
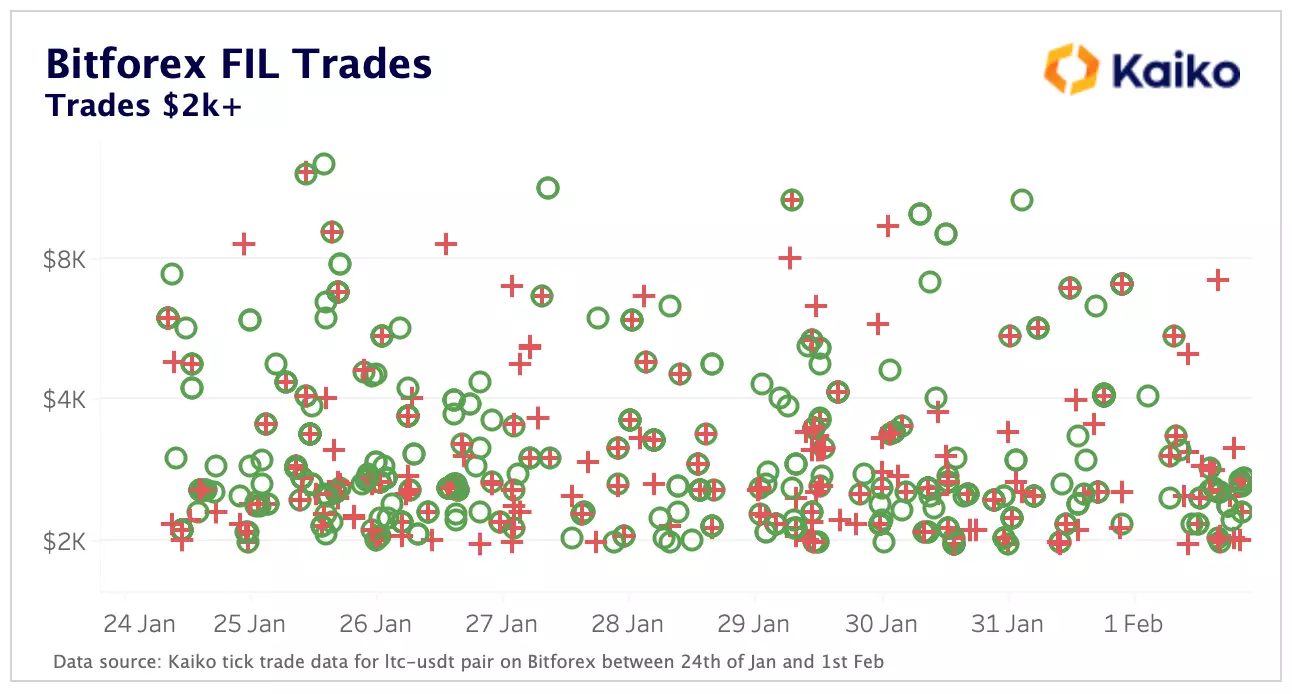
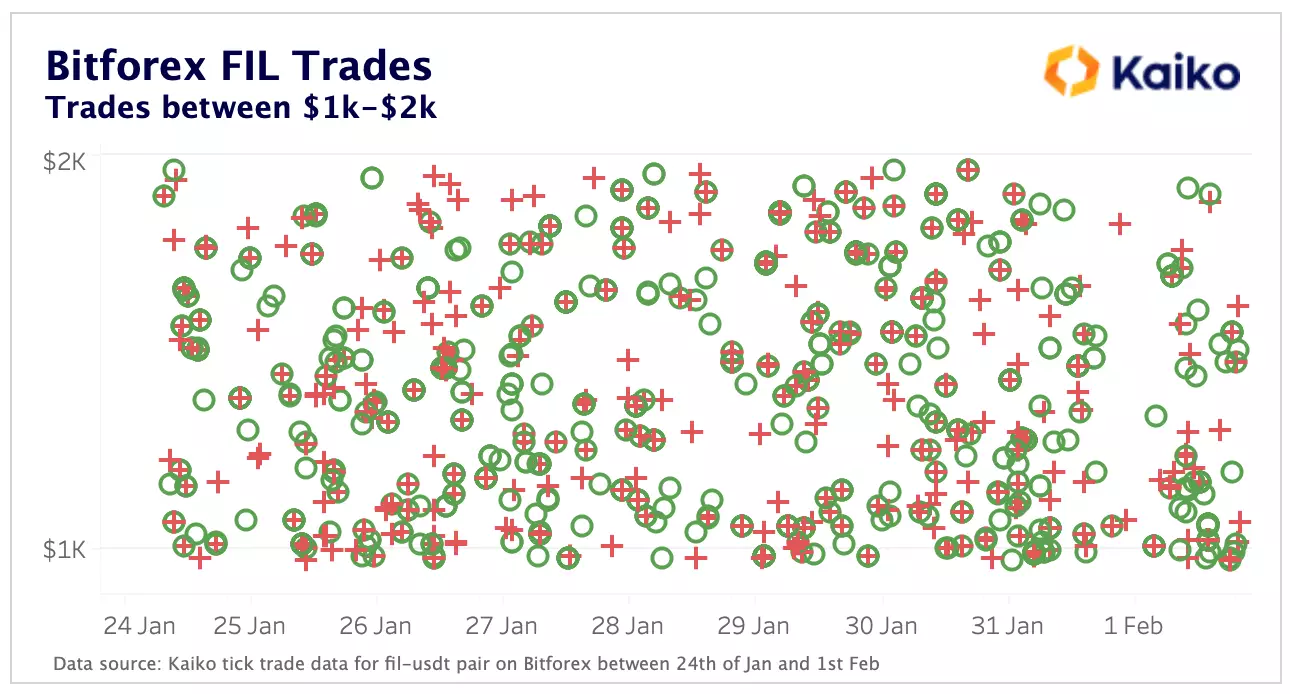
Often times investors are left scratching their heads when they see a small exchange high up the volume ranking on certain websites. The assumption is that some, or a significant amount of these volumes figures are artificially inflated by wash-trading on that exchange. This week, we present a framework that can be used to spot cases of wash-trading, pointing out potential examples of our own on the way.


More From Kaiko Research
![]()
Asia
15/04/2024 Data Debrief
Crypto Fee War Heats Up in South KoreaWelcome to the Data Debrief! Last week, BTC fell in tandem with risk assets amid escalating geopolitical tensions. However, it regained ground early on Monday after Hong Kong reportedly approved spot BTC and ETH ETFs. In other news, the U.S. SEC issued a Wells notice to Uniswap Labs, and MarginFi experienced over $200 million in outflows as its founder exited.
Written by The Kaiko Research Team![]()
Bitcoin
08/04/2024 Data Debrief
All Eyes on the Bitcoin HalvingWelcome to the Data Debrief! BTC had a shaky start of the new quarter, closing last week flat before surging above $72k early Monday. In other news, DeFi protocol Ethena airdroped its ENA token, Ripple announced a stablecoin, and the Ethereum Foundation proposed to reduce ETH issuance.
Written by The Kaiko Research Team![]()
CEX
02/04/2024 Data Debrief
The Impact of the KuCoin ChargesBitcoin dropped 5% early Tuesday as the U.S. Dollar index climbed to four month highs. Meanwhile, SBF was sentenced to 25 years, three AI protocols announced plans to merge, and the London stock exchange decided to allow applications for crypto ETNs.
Written by The Kaiko Research Team![]()
Bitcoin
25/03/2024 Data Debrief
The Return of the Flash CrashBitcoin closed the week in the red, slipping to $67k, amid rising GBTC outflows. In other news, Blackrock unveiled its first tokenized fund on Ethereum, Genesis reached a $21mn settlement with the SEC, and the Ethereum Foundation is reportedly facing a probe by a regulator.
Written by The Kaiko Research Team


