Kaiko's Q1 market report is now live!

Whales vs. Retail: Who’s Using Curve?

Curve

DeFi

Uniswap

Written by Riyad Carey

02/03/2023

Welcome to Deep Dive!

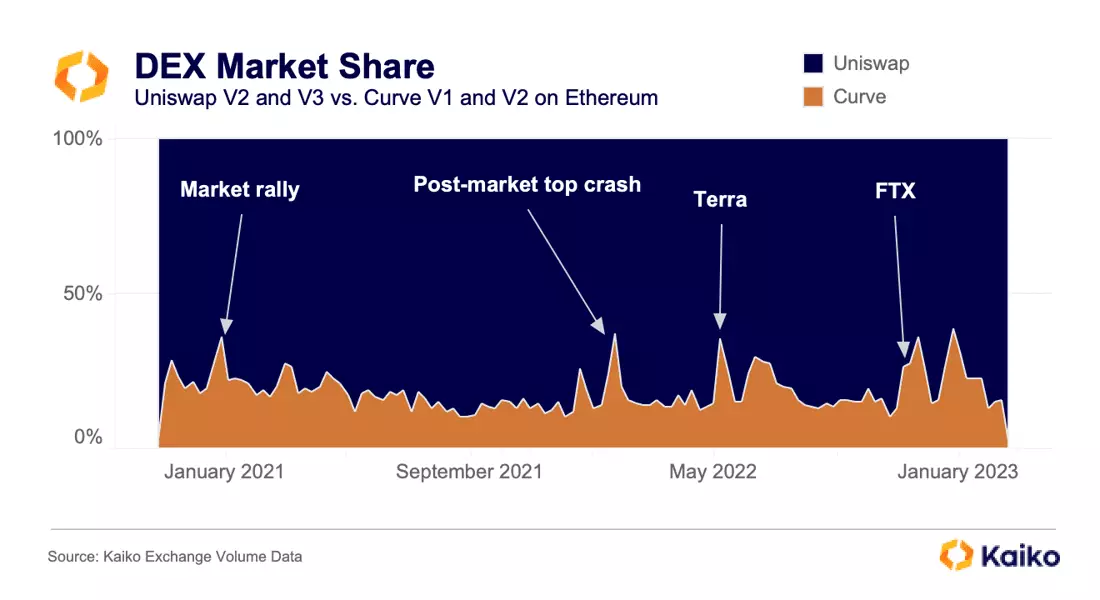
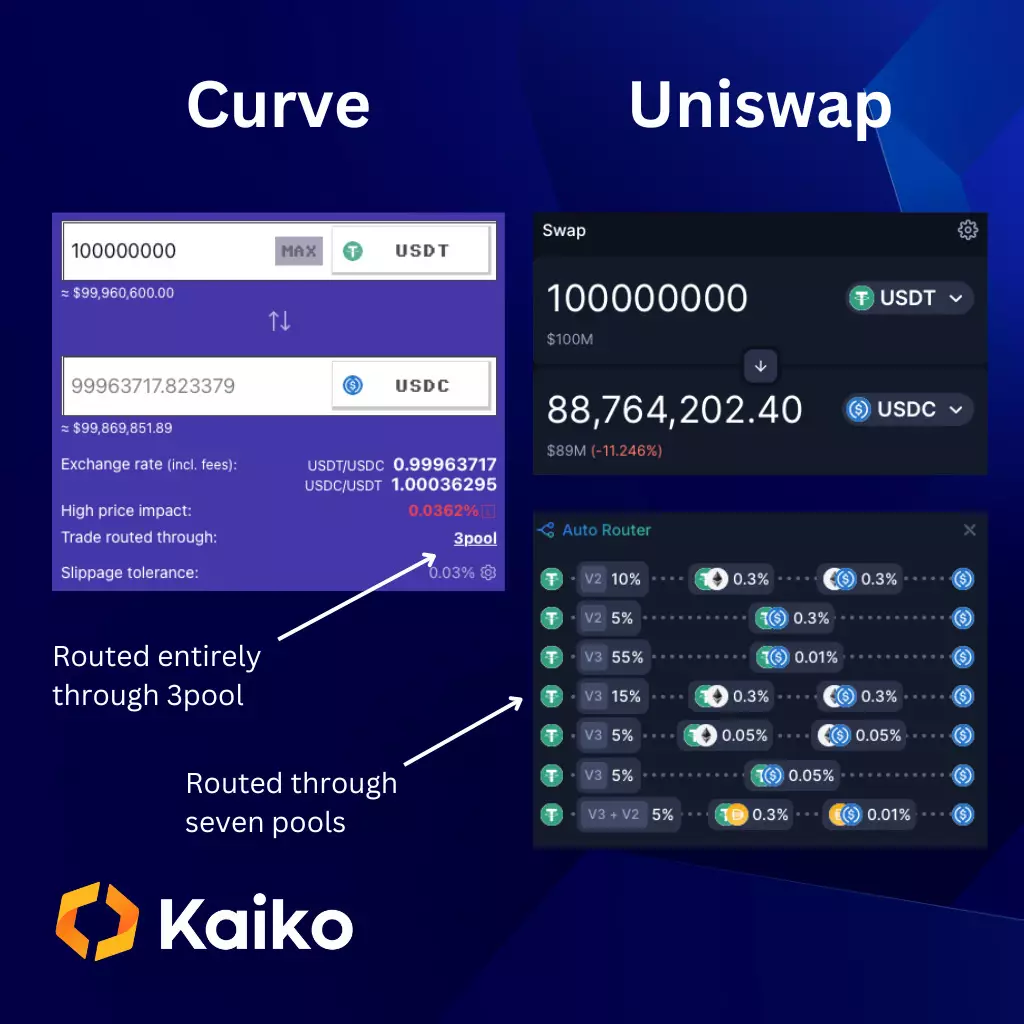
It’s impossible to paint a full picture of Ethereum DeFi without an understanding of Curve. Its unique AMM mechanism enables large stablecoin swaps with extremely low price slippage and its governance and incentives make it a kingmaker for stablecoins; Terra founder Do Kwon touted the infamous 4pool – containing UST – as the thing that would catapult his stablecoin ahead of DAI.

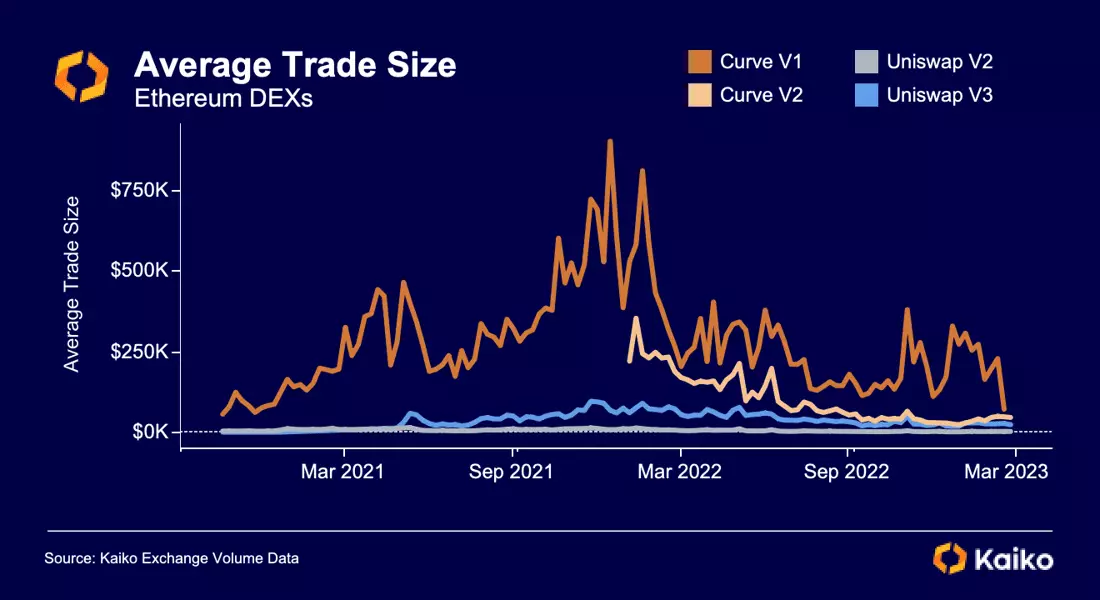
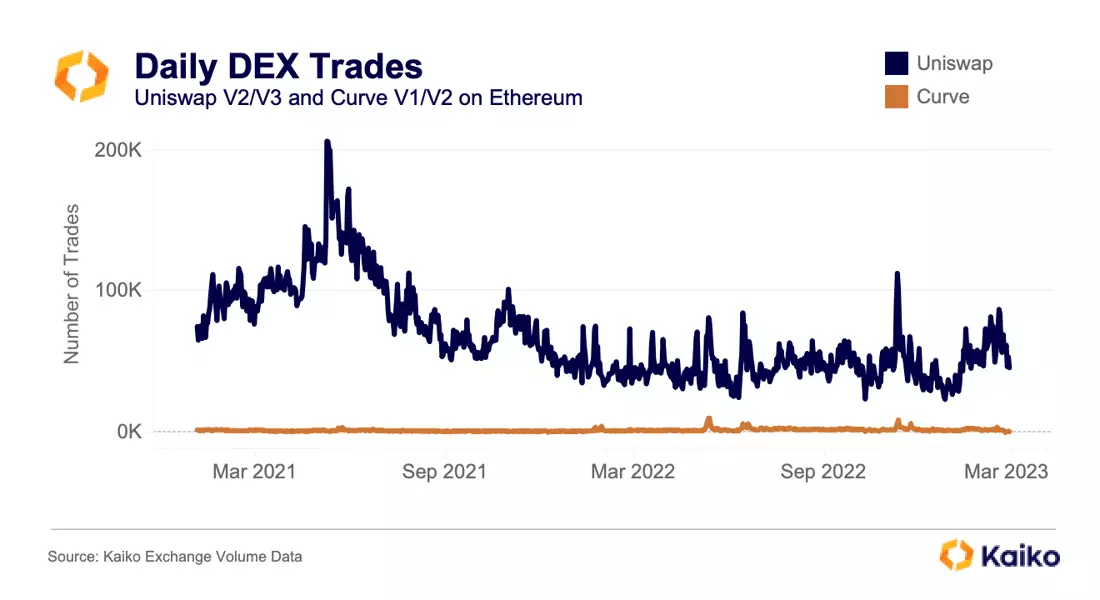
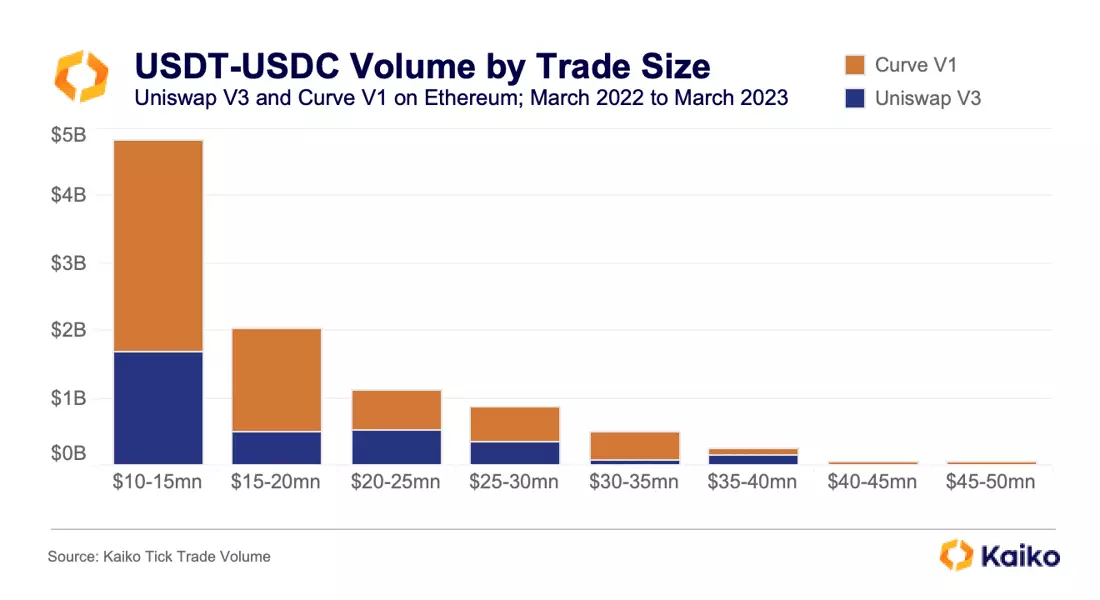
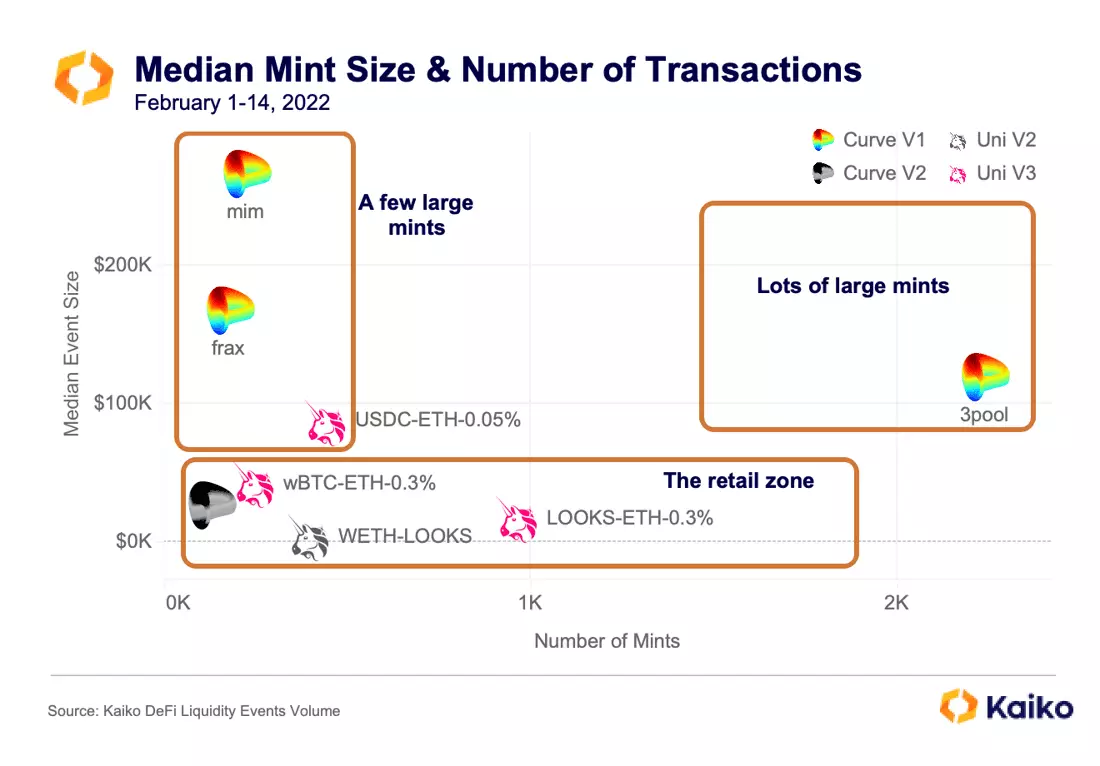
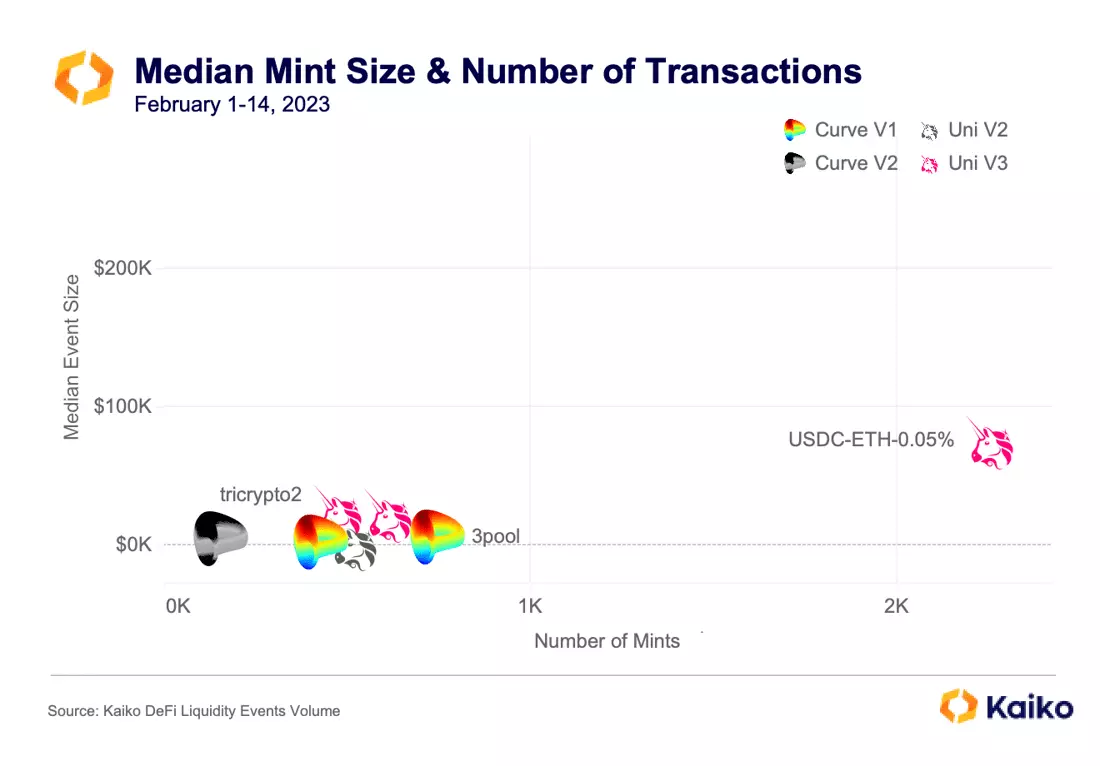
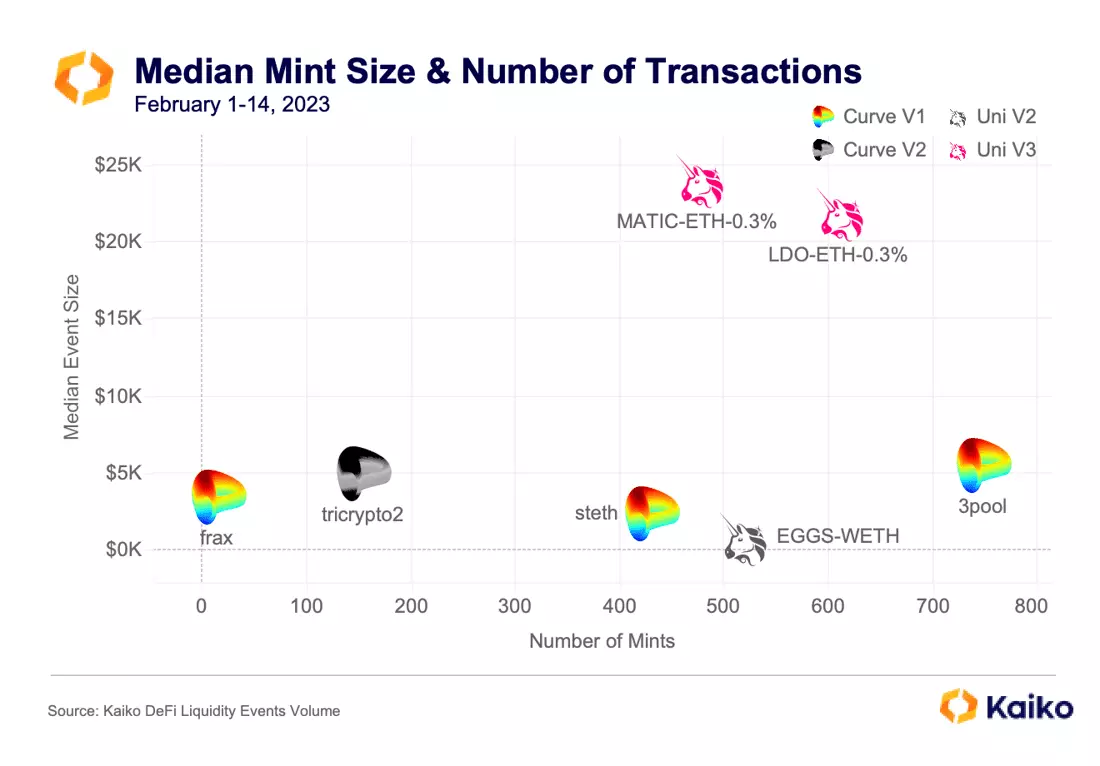
In the past, we have written on how Curve pools can be a useful barometer for stablecoin demand particularly during volatile market events. At Kaiko Research we have always been struck by Curve’s average trade size, which is massive in comparison to all other exchanges, centralized or decentralized. This week we will examine who is trading and providing liquidity on Curve and Uniswap.

  • Curve’s average trade size is much larger than Uniswap’s

  • Curve has never had more weekly trades than Uniswap

  • Uniswap V3 liquidity is more sophisticated

  • Liquidity pools are less active than a year ago

Volume

dex market share

Crucially for Curve, these are also the highest volume weeks overall, meaning the exchange tends to capture a higher percentage of volume as volume increases, especially during times of panic. This is why some have called Curve a machine that converts FUD into fees. Last week was Curve’s lowest market share week since October 2020, at just 2.7%.

The most glaring difference between Curve and Uniswap volumes is average trade size. Throughout the course of the bull run, Curve V1’s average trade size increased from $56k to a massive $904k in December 2021, a couple weeks after BTC’s price peaked. Gas fees certainly played a role in this, as during the peak of the bear market transactions on Ethereum could cost upwards of $100 to complete.

It’s worth emphasizing how unique this is: the highest weekly average trade size for Uniswap V2 was $14k and for V3 it was $95k. Centralized exchanges generally have average trade sizes of $1k to $4k. More than any other exchange, Curve’s trading volume is dominated by whales, whether retail or institutional.

To put a finer point on it: in this timeframe, daily trades on Curve have never exceeded 10k while Uniswap has never had fewer than 23k.

Still, Curve’s volume remains respectable compared to Uniswap. This is because its mechanism is more conducive to large swaps. Below is an example of a $100mn swap of USDT to USDC. Curve is able to route the entire trade through its 3pool with about $100k of slippage, while the same trade on Uniswap would be routed through seven different pools and lose over $11mn in slippage.

This advantage for Curve is reflected in the data. In the past year, Uniswap V3 has facilitated more USDT-USDC volume than Curve V1 – $38.7bn to $27.9bn. However, Curve has a significant lead in trades larger than $10mn.

For trades between $10mn and $15mn, Curve V1 had $3.1bn in volume compared to $1.6bn on Uniswap V3. For trades between $15mn and $20mn, it was $1.5bn to $490mn. Uniswap did not have any trades larger than $40mn in this timeframe.

Never Miss a Deep Dive.

Liquidity

The original thesis I had before writing my recent piece on just-in-time liquidity was that Uniswap V3 is used more by retail traders while most of its liquidity is supplied by whales (this can be institutions or sophisticated and well-capitalized individuals); Curve is used more by whales while more of its liquidity comes from retail. After researching I’ve found that this is too simplistic.

In early 2022, the median amount of liquidity per transaction added to Curve pools was massive: over $250k for the MIM-3crv pool. Additionally, the 3pool was by far the most active pool on these exchanges, with over 2k mints during this time period, while the second most active was ETH-LOOKS 0.3% on Uniswap V3 with under 1k mints.

Since 2022, this trend has been flipped on its head. Using the same axes as above, the 3pool has moved firmly into the “retail zone” while USDC-ETH 0.05% is the only pool with a median mint size close to $100k. This is the pool that was the subject of my JIT piece, and though its median mint is $75k, its average mint is a whopping $9.5mn because of extremely large JIT transactions.

Removing the outlier USDC-ETH 0.05% pool is helpful to better see how this trend has developed since last year. Median mints in some of the more active Uniswap V3 pools are significantly larger than those in Curve pools. The 3pool’s median mint has shrunk to just $5.5k from $119k a year ago. Meanwhile, the EGGS-ETH Uniswap V2 pool provides a nice baseline for what a growing retail-driven pool looks like: 517 mints with a median size of $716.

On the whole, liquidity pools – particularly the 3pool – are less active than they were a year ago. With median mint sizes of under $6k for all of the major Curve pools, we can confidently say that new liquidity skews retail (on a transaction-by-transaction basis). Meanwhile, Uniswap’s median mint sizes have held mostly steady or grown since 2022, while the average for JIT-heavy pools like ETH-USDC 0.05% has increased dramatically. The more active V3 pools look a lot like the active pools from last year: LDO-ETH 0.3% registered 611 mints with a median of $21.8k this month while LOOKS-ETH 0.3% registered 961 mints with a median of $16.8k last year.

Conclusion

Curve and Uniswap mostly elude any attempts to put them into a neat box. It’s tempting to say that Uniswap V3’s complexity has professionalized its liquidity while retail can find refuge providing liquidity at Curve. This in turn with the reality that Curve is disproportionately used by whales while Uniswap V3 is used more by retail presents a counterintuitive paradigm that is unfortunately a bit too simplistic.

The median Uniswap V3 mint is still small-ish (and much smaller than median Curve mints in 2022) and not indicative of whales being dominant on the liquidity front, even as JIT events have surged in certain pools. It does appear that retail accounts for most of the new liquidity events on Curve while its trading volume is still largely whale-driven. With the exception of JIT-heavy Uniswap V3 pools, median liquidity events are smaller than they were a year ago.

Data Used In This Analysis

More From Kaiko Research

  • Bitcoin

    22/04/2024 Data Debrief

    Bitcoin Halving Is Here

    Welcome to the Data Debrief!  The much-anticipated fourth Bitcoin halving went live on April 20. While BTC ended the week flat, transaction fees experienced strong volatility following the launch of Runes, a protocol for issuing fungible tokens on Bitcoin.

  • Asia

    15/04/2024 Data Debrief

    Crypto Fee War Heats Up in South Korea

    Welcome to the Data Debrief! Last week, BTC fell in tandem with risk assets amid escalating geopolitical tensions. However, it  regained ground early on Monday after Hong Kong reportedly approved spot BTC and ETH ETFs. In other news, the U.S. SEC issued a Wells notice to Uniswap Labs, and MarginFi experienced over $200 million in outflows as its founder exited.

  • Bitcoin

    08/04/2024 Data Debrief

    All Eyes on the Bitcoin Halving

    Welcome to the Data Debrief! BTC had a shaky start of the new quarter, closing last week flat before surging above $72k early Monday. In other news, DeFi protocol Ethena airdroped its ENA token, Ripple announced a stablecoin, and the Ethereum Foundation proposed to reduce ETH issuance.

  • CEX

    02/04/2024 Data Debrief

    The Impact of the KuCoin Charges

    Bitcoin dropped 5% early Tuesday as the U.S. Dollar index climbed to four month highs. Meanwhile, SBF was sentenced to 25 years, three AI protocols announced plans to merge, and the London stock exchange decided to allow applications for crypto ETNs.